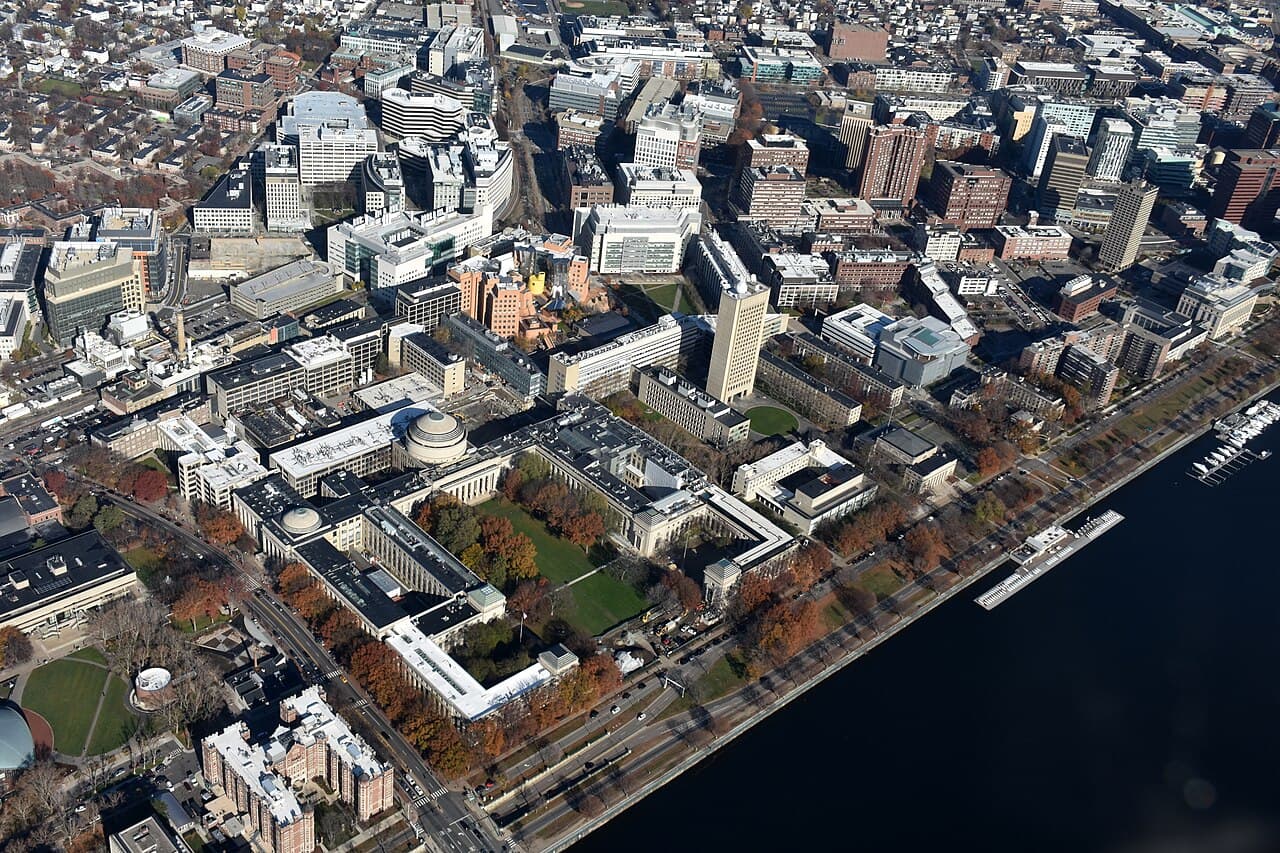

Massachusetts Institute of Technology
Cambridge, MA · Northeast
Massachusetts Institute of Technology has an acceptance rate of 4.5% and a middle-50% SAT range of 1520-1580. The numbers below show who gets in and what it costs.
- Acceptance rate
- 4.5%
- SAT mid-50
- 1520-1580
- Cost after aid
- $20,111
- Graduation rate
- 96%
Application deadlines
Official 2026-2027 cycle deadlines for Massachusetts Institute of Technology.
| Plan | Deadline |
|---|---|
Early Action | Nov 1, 2026 |
Regular Decision | Jan 4, 2027 |
What Massachusetts Institute of Technology says matters
How Massachusetts Institute of Technology rates each admissions factor in its Common Data Set, with the full published numbers below.
- SAT mid-50
- 1520-1570
- ACT mid-50
- 34-36
- CDS year
- 2024-25
Very important
- Character or personal qualities
Important
- Rigor of secondary school record
- Academic GPA
- Standardized test scores
- Application essay
- Recommendations
- Interview
- Extracurricular activities
- Talent or ability
Considered
- Class rank
- First generation
- Geographical residence
- Volunteer work
- Work experience
Not considered
- Alumni relation
- State residency
- Religious affiliation or commitment
- Level of applicant's interest
The full Common Data Set
Every figure Massachusetts Institute of Technology published for 2024-25, section by section.
First-Time, First-Year Admission73
Applications
- Total first-time, first-year men who applied
- 17,210
- Total first-time, first-year women who applied
- 8,975
- Total first-time, first-year unknown gender who applied
- 606
- Total first-time, first-year men who were admitted
- 612
- Total first-time, first-year another gender who were admitted
- 547
- Total first-time, first-year unknown gender who were admitted
- 499
- Total part-time, first-time, first-year men who enrolled
- 547
- Total part-time, first-time, first-year women who enrolled
- 499
- Total part-time, first-time, first-year unknown gender who enrolled
- 28,232
- Total first-time, first-year students who applied
- 1,284
Wait List
- Number of qualified applicants offered a place on waiting list:
- 590
- Number accepting a place on the waiting list:
- 509
- Number of wait-listed students admitted:
- 9
Admissions Requirements
- Total academic units
- 4
- Mathematics
- 4
- Science
- 4
- Foreign language
- 2
- Social studies
- 2
Basis for Selection
- Rigor of secondary school record
- Important
- Class rank
- Considered
- Academic GPA
- Important
- Standardized test scores
- Important
- Application Essay
- Important
- Recommendation(s)
- Important
- Interview
- Important
- Extracurricular activities
- Important
- Talent/ability
- Important
- Character/personal qualities
- Very Important
- First generation
- Considered
- Alumni/ae relation
- Not Considered
- Geographical residence
- Considered
- State residency
- Not Considered
- Religious affiliation/commitment
- Not Considered
- Volunteer work
- Considered
- Work experience
- Considered
- Level of applicant’s interest
- Not Considered
First-time, first-year Profile
- Submitting SAT Scores
- 0.83
- Submitting ACT Scores
- 0.29
- Submitting SAT Scores
- 918
- Submitting ACT Scores
- 323
- SAT Composite: 25th Percentile
- 1,520
- SAT Composite: 50th Percentile
- 1,550
- SAT Composite: 75th Percentile
- 1,570
- SAT Evidence-Based Reading and Writing: 25th Percentile
- 740
- SAT Evidence-Based Reading and Writing: 50th Percentile
- 760
- SAT Evidence-Based Reading and Writing: 75th Percentile
- 780
- SAT Math: 25th Percentile
- 780
- SAT Math: 50th Percentile
- 800
- SAT Math: 75th Percentile
- 800
- ACT Composite: 25th Percentile
- 34%
- ACT Composite: 50th Percentile
- 35%
- ACT Composite: 75th Percentile
- 36%
- ACT Math: 25th Percentile
- 35%
- ACT Math: 50th Percentile
- 35%
- ACT Math: 75th Percentile
- 36%
- ACT English: 25th Percentile
- 35%
- ACT English: 50th Percentile
- 35%
- ACT English: 75th Percentile
- 36%
- SAT Composite: 1400-1600
- 98.8
- SAT Composite: 1200-1399
- 1.2
- SAT Composite: 1000-1199
- 0
- SAT Composite: 800-999
- 0
- SAT Composite: 600-799
- 0
- SAT Composite: 400-599
- 0
- Percent in top tenth of high school graduating class
- 96%
- Percent in top quarter of high school graduating class
- 99%
- Percent in top half of high school graduating class
- 100%
- Percent in bottom half of high school graduating class
- 0
- Percent in bottom quarter of high school graduating class
- 0
- Percent of total first-time, first-year students who submitted high school class rank:
- 30%
Admission Policies
- Amount of application fee:
- 75
- Can it be waived for applicants with financial need?
- Yes
- If yes, maximum period of postponement:
- 2 years
Transfer Admission8
Application for Admission
- Must a transfer applicant have a minimum number of credits completed or else must apply as an entering first-year student?
- No
- High school transcript
- Required of All
- College transcript(s)
- Required of All
- Essay or personal statement
- Required of All
- Interview
- Required of All
- Standardized test scores
- Required of All
- Statement of good standing from prior institution(s)
- Required of All
- List any other application requirements specific to transfer applicants:
- **
Student Life16
Percent Participating
- Percent who are from out of state (exclude international/nonresidents from the numerator and denominator)
- 91%
- Percent of men who join fraternities
- 50%
- Percent of women who join sororities
- 34%
- Percent who live in college-owned, -operated, or -affiliated housing
- 100%
- Percent who live off campus or commute
- 0
- Percent of students age 25 and older
- 0
- Percent who are from out of state (exclude international/nonresidents from the numerator and denominator)
- 91%
- Percent of men who join fraternities
- 41%
- Percent of women who join sororities
- 25%
- Percent who live in college-owned, -operated, or -affiliated housing
- 92%
- Percent who live off campus or commute
- 8.0%
- Percent of students age 25 and older
- 100%
Average Age
- Average age of full-time students
- 19
- Average age of all students (full- and part-time)
- 19
- Average age of full-time students
- 20
- Average age of all students (full- and part-time)
- 20
Annual Expenses2
Private Tuition
- Tuition
- 64310
- Tuition
- 64310
Financial Aid20
Methodology
- Both FM and IM
- 8482666
Need-based Aid Awarded
- Federal
- 7300
- State all states, not only the state in which your institution is located
- 158352409
- Institutional: Endowed scholarships, annual gifts and tuition funded grants, awarded by the college, excluding athletic aid and tuition waivers (which are reported below).
- 4534059
- Scholarships/grants from external sources (e.g. Kiwanis, National Merit) not awarded by the college
- 171376434
- Total Scholarships/Grants
- 493938
- Student loans from all sources (excluding parent loans)
- 701482
- Federal Work-Study
- 3502605
- State and other (e.g., institutional) work-study/employment (Note: Excludes Federal Work-Study captured above.)
- 4698025
- Total Self-Help
- 111917
- Athletic Awards
- 0
Non-need-based Aid Awarded
- Federal
- 0
- State all states, not only the state in which your institution is located
- 0
- Institutional: Endowed scholarships, annual gifts and tuition funded grants, awarded by the college, excluding athletic aid and tuition waivers (which are reported below).
- 2721578
- Scholarships/grants from external sources (e.g. Kiwanis, National Merit) not awarded by the college
- 2721578
- Total Scholarships/Grants
- 2663735
- Student loans from all sources (excluding parent loans)
- 1020943
- State and other (e.g., institutional) work-study/employment (Note: Excludes Federal Work-Study captured above.)
- 3684678
- Total Self-Help
- 2513910
Graduating Cohort
- Provide the number of students in the 2024 undergraduate class who started at your institution as first-time students and received a bachelor's degree between July 1, 2023 and June 30, 2024. Exclude students who transferred into your institution.
- 1,078
Enrollment And Persistence30
Enrollment by Racial/Ethnic Category
- Nonresidents
- 125
- Hispanic/Latino
- 118
- Black or African American, non-Hispanic
- 41
- White, non-Hispanic
- 263
- American Indian or Alaska Native, non-Hispanic
- 3
- Asian, non-Hispanic
- 462
- Native Hawaiian or other Pacific Islander, non-Hispanic
- 1
- Two or more races, non-Hispanic
- 60
- Race and/or ethnicity unknown
- 25
- TOTAL
- 1,098
- Nonresidents
- 529
- Hispanic/Latino
- 639
- Black or African American, non-Hispanic
- 349
- White, non-Hispanic
- 964
- American Indian or Alaska Native, non-Hispanic
- 9
- Asian, non-Hispanic
- 1,595
- Native Hawaiian or other Pacific Islander, non-Hispanic
- 2
- Two or more races, non-Hispanic
- 310
- Race and/or ethnicity unknown
- 138
- TOTAL
- 4,535
- Nonresidents
- 529
- Hispanic/Latino
- 639
- Black or African American, non-Hispanic
- 349
- White, non-Hispanic
- 964
- American Indian or Alaska Native, non-Hispanic
- 9
- Asian, non-Hispanic
- 1,595
- Native Hawaiian or other Pacific Islander, non-Hispanic
- 2
- Two or more races, non-Hispanic
- 310
- Race and/or ethnicity unknown
- 138
- TOTAL
- 4,535
Instructional Faculty And Class Size19
Student to Faculty Ratio
- Fall 2024 Student to Faculty ratio
- 3
- based on ____ students
- 4,504
- and ____ faculty
- 1,466
Undergraduate Class Size
- 2-9
- 449
- 10-19
- 449
- 20-29
- 295
- 30-39
- 119
- 40-49
- 66
- 50-99
- 49
- 100+
- 79
- Total
- 41
- 2-9
- 60
- 10-19
- 60
- 20-29
- 103
- 30-39
- 50
- 40-49
- 20
- 50-99
- 13
- 100+
- 22
- Total
- 3
About Massachusetts Institute of Technology
Massachusetts Institute of Technology is a small private university in Cambridge, MA, in a city setting.
What Massachusetts Institute of Technology looks for
Acceptance is roughly 5%, so admitted students nearly always have stats above the bottom of the mid-50. That said, stats alone do not get anyone in here. The applications that work read as coherent applicants with a clear academic and personal narrative more than as resumes. Admissions officers are reading for specifics: what you actually did, what you cared enough to follow through on, and how you write when you sound like yourself rather than a candidate.
Frequently asked
What SAT score do I need for Massachusetts Institute of Technology?
Massachusetts Institute of Technology's middle 50% SAT range is 1520 to 1580. A score in or above that band keeps you in the conversation; below it, the rest of your application has to do more work.
What ACT score do I need for Massachusetts Institute of Technology?
Middle 50% ACT range is 34 to 36. The top of that range or above is what most admitted students submit when they choose to send a score.
What is the acceptance rate at Massachusetts Institute of Technology?
Massachusetts Institute of Technology admits roughly 5% of applicants. That makes it a reach for nearly everyone, regardless of stats.
What does Massachusetts Institute of Technology actually cost after financial aid?
Average net cost (after institutional aid) is about $20,111 per year. Net cost varies enormously by family income; run the school's net price calculator for an estimate that reflects your situation.
Is Massachusetts Institute of Technology a reach, match, or safety for me?
Compare your stats to the middle 50% above. If you are at or below the 25th percentile, treat Massachusetts Institute of Technology as a reach. If you are in the middle 50%, it is a match. Above the 75th percentile and the school accepts above 25% overall, it is closer to a safety. Selectivity below 20% should be treated as a reach for everyone, period.


